Mobius Time Sheet Gadget Documentation Overview
- Rick Hecker
Welcome to the documentation overview for Mobius Time Sheet Gadget for JIRA Cloud. This document will aid you in adding the gadget to a dashboard, modifying it's filters and views, and making use of the data that it provides.
How do I add the Mobius Time Sheet Gadget to my JIRA Cloud Dashboard after installation?
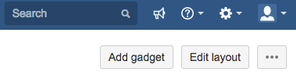
Easy! Simply click on the "Add gadget" button at the top right of your JIRA Cloud dashboard:
In the resulting popup, type in the search bar "Mobius". You should see the Mobius Timesheet gadget listed. If you don't, make sure to click the "show all gadgets" text link.
Click on the "Add gadget" button next to the listing.
What if I don't see the "Add gadget" button?
This is due to your user role not having permissions to edit this dashboard. Please contact your administrator to get permissions to this dashboard, or create your own dashboard and you will automatically have rights to edit and add to it.
How do I change filter options, rollup by, or change to week/month view?
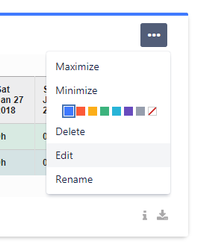
Once you've added the gadget to your dashboard, hover over the three dots in the top-right corner of the gadget and select the "Edit" option.
What if I don't see the "Edit" option?
This is due to your user role not having permissions to edit this dashboard. Please contact your administrator to get permissions to this dashboard, or create your own dashboard and you will automatically have rights to edit and add to it.